From WebFlux API to Full Observability: Monitoring AI Inference with Prometheus and Grafana
In my previous Building a High-Concurrency AI Moderation Service with Spring WebFlux — From Concept to Production I walked through building a high-concurrency NSFW image moderation API using Spring WebFlux and DJL (Deep Java Library). That project focused on scalability: turning deep learning inference into a production-ready, non-blocking API service.
But high concurrency alone is not enough for real-world systems. In production, we also need observability, that is the ability to measure request latency, success/failure rates, and resource utilization in real time. Without monitoring, scaling an AI service is like driving a race car without a dashboard.
This post describes how I extended the WebFlux moderation service with Prometheus + Grafana to create a complete monitoring stack.
1. Why Monitoring Matters for AI Services
AI inference has unique challenges compared to typical CRUD APIs:
- Latency variability: Each inference may take hundreds of milliseconds, sometimes seconds.
- Throughput bottlenecks: Model execution is CPU/GPU bound, not just I/O.
- Operational debugging: When users report “slow API,” you need more than logs — you need latency distributions, error ratios, and real-time dashboards.
Prometheus and Grafana provide exactly this: a metrics pipeline from application → storage → visualization.
2. Integrating Micrometer and Prometheus in Spring WebFlux
Spring Boot already supports Micrometer out of the box. I added the following dependency to the moderation-flux project.
<dependency>
    <groupId>io.micrometer</groupId>
    <artifactId>micrometer-registry-prometheus</artifactId>
</dependency>
<dependency>
    <groupId>org.springframework.boot</groupId>
    <artifactId>spring-boot-starter-actuator</artifactId>
</dependency>
And enabled the Prometheus endpoint in application.yml.
management:
  endpoints:
    web:
      exposure:
        include: health,info,prometheus
  metrics:
    tags:
      application: moderation-flux
When the app runs, metrics are exposed at actuator/prometheus,
For Example:
http://localhost:8080/actuator/prometheus
3. Custom Metrics for AI Inference
Generic JVM metrics are nice, but I needed domain-specific observability: how many requests succeed, how many fail, and how long inference takes.
In ModerationFluxController I added Micrometer counters and timers.
@Timed(value = "model.inference.time", description = "Time taken for model inference")
@PostMapping(value = "/check", consumes = MediaType.MULTIPART_FORM_DATA_VALUE)
public Mono<ModerationResult> check(@RequestPart("file") FilePart file) {
    long start = System.nanoTime();

    return service.classify(file)
        .doOnSuccess(r -> meterRegistry.counter("model.inference.success").increment())
        .doOnError(e -> meterRegistry.counter("model.inference.error").increment())
        .doFinally(sig -> {
            long duration = System.nanoTime() - start;
            meterRegistry.timer("model.inference.latency")
                         .record(duration, TimeUnit.NANOSECONDS);
        });
}
This gives us three critical metrics:
model_inference_success_totalmodel_inference_error_totalmodel_inference_latency_seconds
4. Installing and Running Prometheus and Grafana Locally
First, I installed Prometheus by direct binary installation method. Then run it.
./prometheus --config.file=prometheus.yml
In the configuration (prometheus.yml), I added my WebFlux service as a scrape target.
global:
  scrape_interval: 5s

scrape_configs:
  - job_name: 'moderation-flux'
    metrics_path: '/actuator/prometheus'
    static_configs:
      - targets: ['localhost:8080']
Once started, Prometheus continuously scrapes metrics from the application every 5 seconds.

5. Visualizing in Grafana
Download Grafana and run it.
./grafana-server
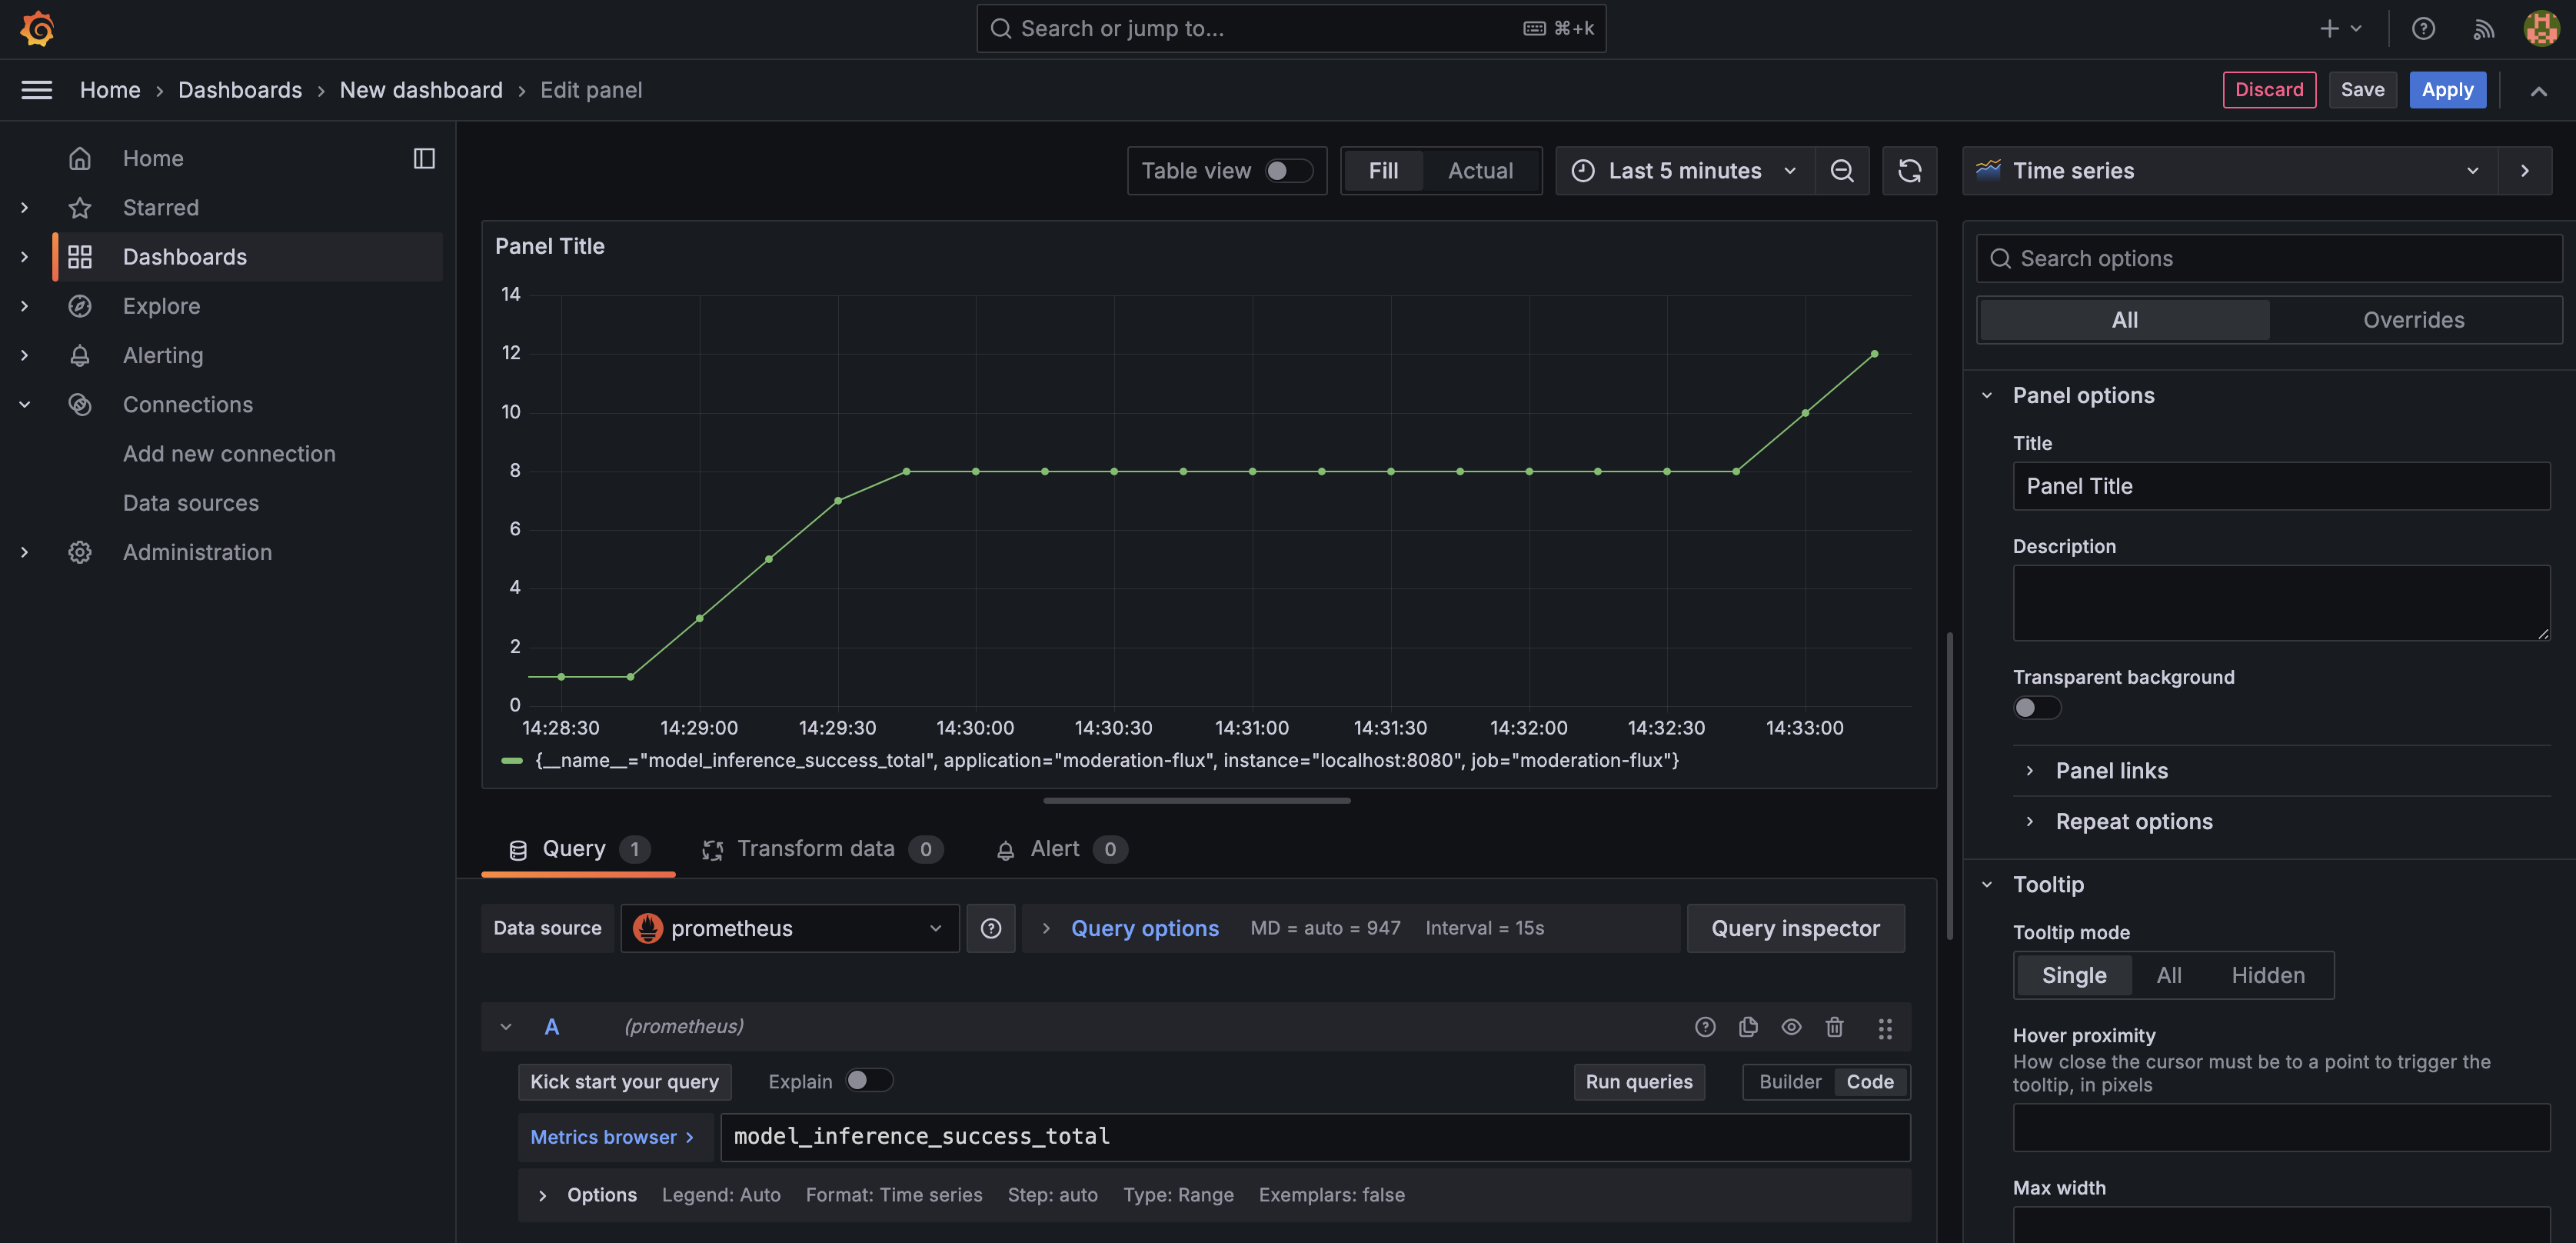
After Grafana successfully connected to Prometheus, I created a new dashboard to visualize my custom inference metrics.
Here’s the Grafana dashboard showing the cumulative success counter as I fired multiple test requests from the WebFlux API. This setup gives immediate visibility into inference load and performance.

6. Lessons Learned
- Metrics are code: You don’t just “turn on monitoring.” You have to decide what to measure and instrument it in code.
- Prometheus + Grafana are a natural fit: Prometheus pulls metrics, Grafana visualizes them beautifully.
- Observability closes the loop: With WebFlux I solved the concurrency bottleneck. With Prometheus + Grafana I now know exactly how the service behaves under stress.
With just a few dependencies and some custom metrics, my WebFlux AI moderation API evolved from a “fast service” into a fully observable system.
Spring WebFlux + DJL gave me scalability.
Prometheus + Grafana gave me visibility.
Together, they provide the foundation for a production-ready AI platform.
Related Resources
- Spring Boot Actuator Documentation
- Micrometer Documentation
- Prometheus Official Documentation
- Grafana Documentation
- Related post: Building an AI Moderation API with Spring Boot & WebFlux
- Related post: Spring MVC vs WebFlux: A Practical Look at Concurrency and Performance
- Related post: Building a High-Concurrency AI Moderation Service with Spring WebFlux — From Concept to Production